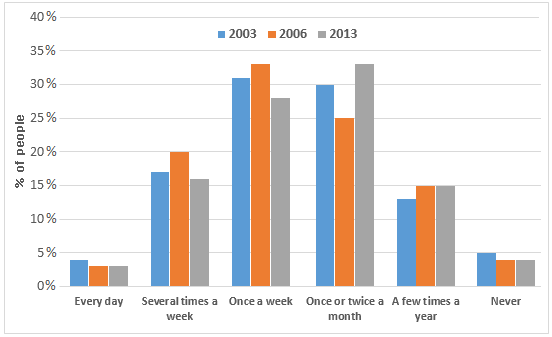
The chart depicts information about the frequency of USA people going for eating at fast food restaurants during the time period of 2003 to 2013.
It can be clearly seen from the figure that it is evenly distributed in a group of two. Like the people visiting restaurant every day and never is almost 5% or less than it during all the given years. The people visiting several time a week and a few times a year is around 15%. People visiting several times a week is around more than 15%; whereas people visiting a few time a year is 15% or less than it during the given time period. People visiting the restaurants once a week and once or twice a month is highest compared to others during the time period. Among which, once a week in 2006 and once or twice a month in 2013 has been recorded the highest about 33%.
Thus it can be concluded that the frequency USA people ate at fast food restaurants during the time period of 2003 to 2013 was neither too much often nor too less; it was like an average visit.
No comments:
Post a Comment