Friday, January 18, 2019

The chart below shows how frequently people in the USA ate at fast food restaurants between 2003 and 2013.(Ielts Writing Task 1)

The chart depicts information about the frequency of USA people going for eating at fast food restaurants during the time period of 2003 to 2013.

It can be clearly seen from the figure that it is evenly distributed in a group of two. Like the people visiting restaurant every day and never is almost 5% or less than it during all the given years. The people visiting several time a week and a few times a year is around 15%. People visiting several times a week is around more than 15%; whereas people visiting a few time a year is 15% or less than it during the given time period. People visiting the restaurants once a week and once or twice a month is highest compared to others during the time period. Among which, once a week in 2006 and once or twice a month in 2013 has been recorded the highest about 33%.

Thus it can be concluded that the frequency USA people ate at fast food restaurants during the time period of 2003 to 2013 was neither too much often nor too less; it was like an average visit.
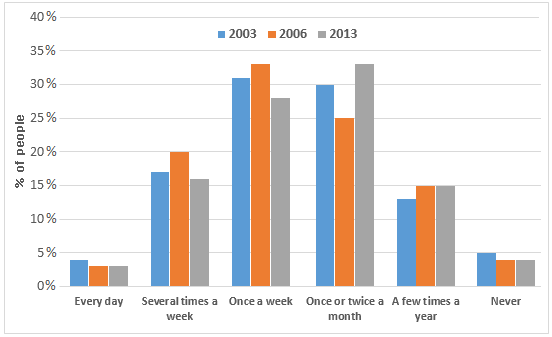
Bar Graph - How frequently people in the USA ate at fast food restaurants

Thursday, January 17, 2019

In a number of countries, some people think it is necessary to spend large sums of money on constructing new railway lines for very fast trains between cities. Others believe the money should be spent on improving existing public transport.(Ielts Writing Task 2 Essay)

Some people almost in every country of the world that the money should be spent on making the new railway lines for the faster trains by the government; whereas some people believe it to be spent on upgrading recent transport facilities.

Some people think that the huge amount of money should be spent on producing new railway lines. The faster trains must be allocated the new railway lines for proper and careful execution. Like for example making underground railway routes which in the road routes which in between the ground rail routes will not be a hindrance. The train can also move fastly and smoothly not wasting the time of the people in the transportation. Another example is making railway lines for metro-like faster trains which will be at a height from the ground.

Whereas some people believe that the money should be spent on enhancing the current public transportation with better facilities. There is a lack of toilet facilities in almost every transportation. Nowadays due to an increase in the numbers of people, there is an increase in the numbers of people travelling through public transport which will make transportation more difficult.

According to me, both have their own pros and cons. If there will be an increase in the number of people travelling, there will be necessary for including more number of trains which will surely be needed to make new railway lines.

Thus according to me, there must be a balanced way of spending money on making new railway tracks as well as making currently available transportation more better.

Wednesday, January 16, 2019

The chart below shows how frequently people in the USA ate at fast food restaurants between 2003 and 2013.(Ielts Writing Task 1)

The bar graphs depict the information about the people going to eating at fast-food restaurants in the USA in 2003, 2006 and 2013. A comparison is shown between the years.

The people visiting restaurant every day was less than 5% during the given years; whereas the people visiting the restaurants once a week and once or twice a month is quite more as compared to the other visiting frequencies. Both comprising around 30% in almost every year. The one never visiting fast-food restaurants has remained around 5% during the years. Several times a week and a few times a year visit to the restaurants by the people is around 15% almost during the given years. The visiting frequencies during the years have remained quite similar.

Thus it can be concluded that visiting fast-food restaurants among people in the USA once a week and once or twice a month during the period has remained quite popular.

Tuesday, January 15, 2019

Some people believe that nowadays we have too many choices. To what extent do you agree or disagree to this statement?(IELTS Writing Task 2)

According to some people, there are so many options available in the world. I would agree with that there are so many alternatives for the existing things.

Firstly, talking about food; we are having so many cuisines available with us. Like for example, we can have Thai, Chinese, Lebanese like intercontinental food. Then talking about the business we can go for includes marketing, online-business, management and others like courses. We are also having so many options available for clothing. In men we are having jeans, shorts, track pants and many more; whereas in women, they can select among saree, trousers, skirts and much more. Due to advance in technology we are having so many options to select from; whether it is mobile devices like smartphones, tablets, laptops and others. In it, we are having many games to play with or applications that can be used for different purposes.

According to me, there are some topics or fields where choices are lesser. Talking about education in my country, after primary studies, we are having many options to select from like Arts, Science, Commerce. But after completing higher secondary studies the course to select from will get lesser in or after graduation. You have to select among the limited options available only. In some condition, you have to opt for it or just stay out there. There are no other options available for us.

Thus concluding I believe that the world is full of opportunities and choices to select from; it totally depends on the people whether to take chance or just leave it.

The chart below shows the percentage of households in owned and rented accommodation in England and Wales between 1918 and 2011. Summarize the information by selecting and reporting the main features, and make comparisons where relevant.(Ielts Writing Task 1)

The bar graphs depict the information about the houses that are owned and rented by the people during time period of 1918 to 2011 in England and Wales.

It can be clearly seen from the graphs that in earlier times during 1918 the houses were rented at maximum around 80%, which slowly decreased as by the passing years. Till 2001 the percentage of households in rented accommodation has decreased near to 30%, which slightly increased in 2011 to around 35%.

The percentage of households in owned accommodation has been lesser in earlier times during 2018 around 20%, which by passing time reached a maximum around 70% in 2001. Then in 2011, there was a slight decrease in percentage of it which comes around 60%.

It can be clearly seen from the figure that in earlier times during 1918 to 1961, the rented accommodation was quite more as compared to owned; whereas during 1981 to 2011, the owner was more as compared to rent.

Thus it can be concluded that during earlier times more people in England and Wales used to stay in rented accommodation; whereas the percentage of owning the houses started increasing after 1971.

How to Fight Overthinking or Negative Thoughts?

How to Combat Overthinking or Negative Thoughts? 1. Don’t Fight Your Thoughts Trying to suppress or control negative thoughts often backfire...